
Why technology diagrams help explain computing. This article looks at the value technology diagrams bring to an organization and asks the questions, does your organization have diagrams that explain their technology?
If not, that maybe its why their users aren’t understanding how things work.
Are there any Technology Diagrams in the house?
I was recently speaking to a senior leader in a large training organisation.
He said to me, “Chris, I don’t know how to navigate around the training system, there’s nothing to help me.”
It seems that his training system is closely integrated to the funding system.
That makes sense; the parent organisation provides the funding, the training organisation delivers the training and the funding needs to be matched to the training provided.
People are funded for training so they need to reconcile and measure the cost of training back to the funding.
The interesting thing about his role is he’s one of those guys who has to closely match the funding to the delivery of the training, so he has to know what’s going on, in other words the students will be guaranteed training funds, so he needs to find his way around the system.
So, here’s the problem, he can’t.
Technology Diagrams are essential for organisations, all sizes
Here’s a snap shot of how an organization’s technology requirements grow:
- In the early days, everyone needed a specific solution; teachers needed a learning system, accountants needed a finance package, stores needed a purchasing inventory management system, designers needed niche graphic design systems, and so the story goes.
- As the organisation grows further, IT flourishes, costs rise due to purchasing, licensing and maintenance of software, hardware and networks technology costs rise, efficiencies are required.
- One way of optimisation is integration. Integration is bringing functions together so information can be shared – Organisations create IT Architecture to provide a strategy to consolidate and integrate systems, create efficiencies and optimise the bang for buck. Typically organisations move to an Enterprise Resource Planning (ERP) system, that hopefully becomes the backbone and joins all the moving parts.
In the case of the organisation in our example, it seems one of the things the leadership had done was to integrate its funding base functions with the delivery of its training services, mainly its learning management system, a central piece of technology.
Here’s where I guess the challenge has arisen.
Somewhere between the technology enterprise architecture, system design and delivery, someone hasn’t provided some kind of picture on how everything is flows between systems.
Now, here’s the trick, how do you make it easy for the users to understand how this big thing works?
Tip…Give users lots of diagrams, presentations and videos as part of their training to understand the technology systems.
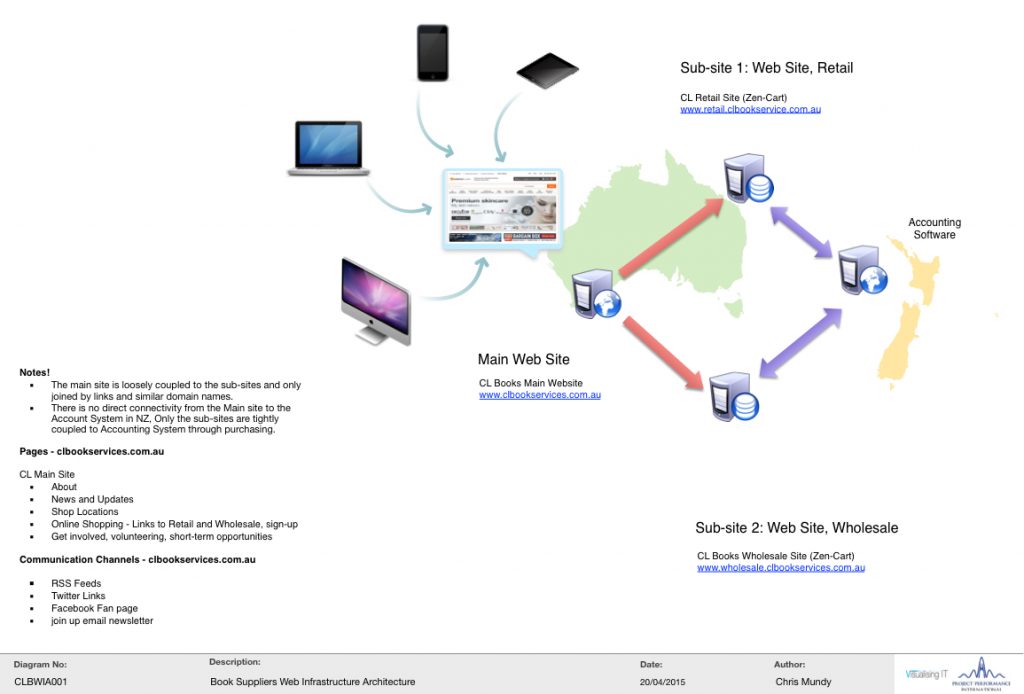
A basic conceptual web design
We have to help people find their way around systems, easily.
That’s where diagrams, presentations and videos really assist, they make it easy.
Why Technology Diagrams help explain computing
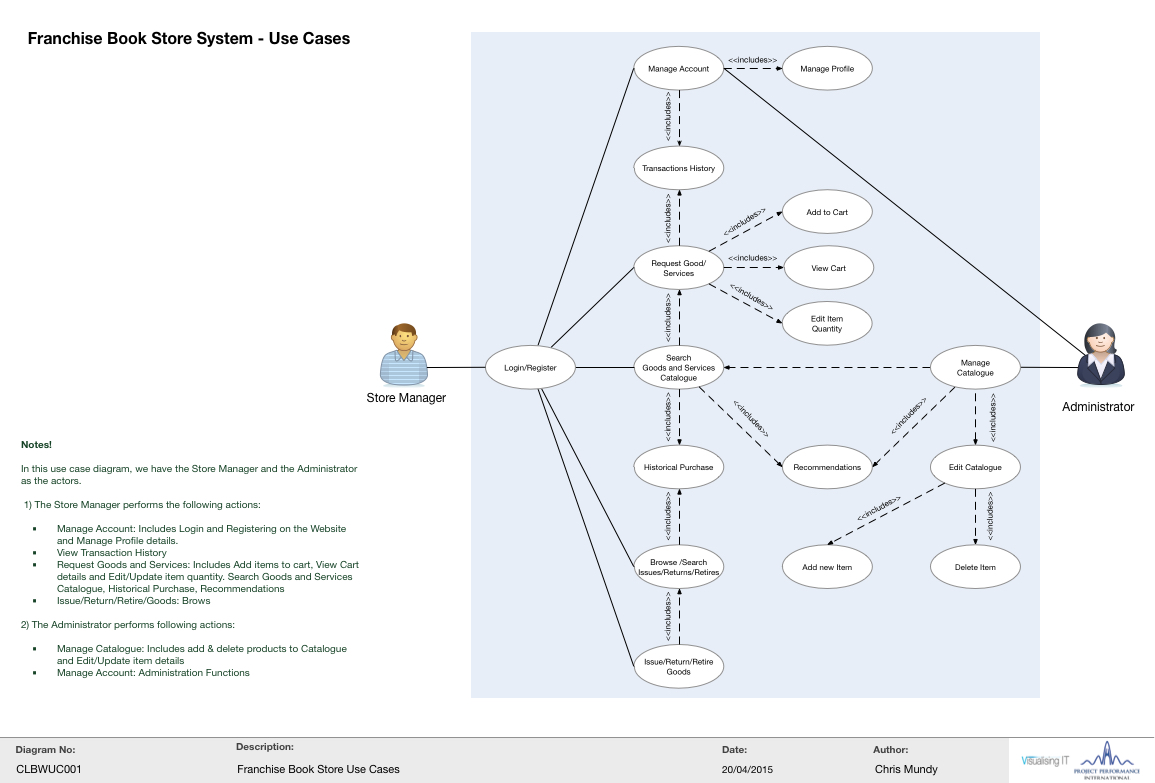
Example of a Use Case Diagram for a book store
The reason you use diagrams to explain computing is the majority of people understand a visual message easier than a written message.
Let’s take visual messages like road signs and ask, why are they successful?
- They’re quick to read
- They’re easy to understand
- They’re consistent and similar world wide.

By Bidgee (Own work) [CC BY 4.0 https://creativecommons.org/licenses/by/4.0/, via Wikimedia Commons
- Quick to read
- Easy to understand
- Consistent and similar
If done right, the correct diagram gets the message across quickly.
If you use the same types of codes, symbols, styles and colours, the message is easier to read and understand.
If you applied the above three points to all technology diagrams within an organization, how much more easily would it help anybody in an organization
- understand how the technology works
- know the fundamentals of how information flows around the systems and
- be more effective in their jobs?
What a Technology Diagram will do?
Successful organisations rely on technology diagrams as they describe:
- The past
- The present, and
- The future.
If done correctly, diagrams become the life blood that help communicate the story of the organisation, visually, especially in the engineering and technology departments.
Where do I start?
Having something is better than nothing, if you have nothing, I would start off with some high-level diagrams or presentations. They can be marketing brochures or concept diagrams of the business.
Develop a plan to have more diagrams and presentations, especially to describe technology that powers the business.
Ask the question, is your organisation using diagrams to explain the technology? If they’re not, they should be.
Understanding what Technology Diagrams users will need
Let’s generalise system users into three groups:
1. Some users are happy just doing their bit
These users are just comfortable using the systems they need to get their job done. If it gets the job done, great, that’s all they’re interested in, doing their bit. They receive training, they get certificates.
2. Some users want to know just a little bit more to do their job well
This group want to know more. They ask questions like, “why does the system do this?” or “what happens when we do this?”.
They need information from the first group of users I just mentioned to get their jobs done.
These people become what we know as system champions.
They’re the people who help the other users. They may have been group one people.
3. Some users like to know how the big picture works
The last group of people are the one’s who need to know how everything works, not from a detailed perspective but how information flows between all the systems.
They need to conceptualise things to help them understand how everything hangs together.
That’s people like my friend. He needs that information for his job.
What types of technology diagrams can you give users?
Here’s some tips for the types of diagrams are needed in an organisation:
- No 1 users – Give users some training manuals and process diagrams
- No 2 users – Give users some process and system flow diagrams along with some operational reports
- No 3 users – Give users some high-level system diagrams so people know about the aspects of how these systems are integrated or glued together and what key information flows between system.
Where to start looking for Technology diagrams

If you’re in a large organisation, take a look at the organisation chart (a diagram) and find the technology leaders.
This could be a Chief Information Officer or a Chief Technology Officer. Depending on the size of the organisation you may be talking to directly to that person or their assistant.
They will usually direct you to either a Chief Technology Officer, Enterprise Architecture or Technology Architecture team. They should have some technology diagrams to assist you.
These teams should have or be working with other business teams that have diagrams or flow charts that describe processes.
Show me the Pictures!
If your organisation doesn’t have any diagrams that explain the technology, then its up to you to start shouting out, “we needs some diagrams!”
When I worked for a large IT organisation, one of the first questions I asked was, “show me the pictures”? Rather, I was pointed to a manual you had to read with a number of concept diagrams, that was it.
Look, it was great book, but I was having problems trying to figure it, so I drew a picture.
That picture eventually grew into a system diagram that helped a lot of people and it helped me.
So when you’re finished reading this article, ask the question, how many diagrams does your organisation have that explain your technology?
If you don’t have any, its time to start drawing some diagrams to help yourself and help others.
Till next time!
Leave a Reply
You must be logged in to post a comment.