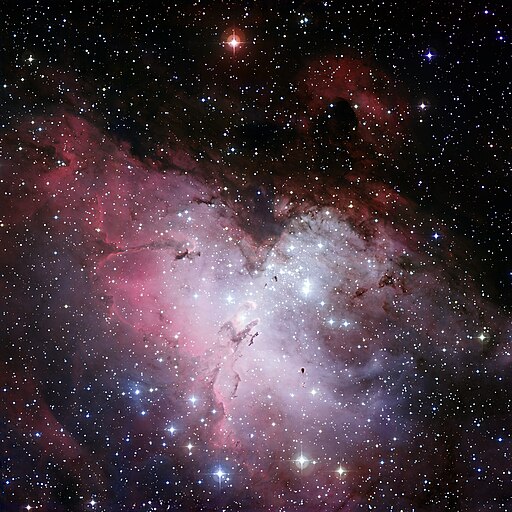
Visualisations allow us to see the universe differently. This short article gives you an idea of how Visualisations give us a different perspective in delving into universe.
Audience for this article
- Business Analysts
- Technical Documenters
- Technical Managers
Background
On April 24, 1990, 12:33:51 UTC, the Hubble Space Telescope was deployed to space, ready to capture pictures of our universe in ways never seen before to the human eye.
![Image of the Hubble Space Telescope - By Ruffnax (Crew of STS-125) [Public domain], via Wikimedia Commons](https://visualisingit.com.au/wp-content/uploads/2016/06/512px-HST-SM4.jpeg)
After some hiccups and issues, in 1993 it was able to capture brilliant pictures that revolutionised our view of the universe.
Some of the pictures displayed such as the Butterfly nebula and the Eagle nebula, are allowing humans to examine the universe in ways we could have never previously understood.


The Hubble telescope has helped resolve some long-standing conversations in astronomy as well as raising new questions.
One of the more interesting aspects of the improved imagery has been a greater depth of questioning and analysis, for example, understanding what are black holes?
Some of the lines of theory and questions around black holes has come in relation to their connectedness between galaxies.
Visualisations, Pictures or Data?
To state the obvious, the pictures the Hubble space telescope has expanded our view in more ways than one on the genesis of the universe, its current state and its future directions.
It really goes to show the power of an image. Armed with the information from the Hubble space telescope, the next thing to do was to extract information that can be turned into data sets.
This is a typical case of information, raw data, and information about the data, metadata.
When you bring together the dynamics of what you can do with data and metadata, this allows us to examine and understand things more deeply.
When this occurs, we start seeing patterns and relationships.
The Network behind the Cosmic Web
What is the cosmic web?
The cosmic web is a network of filaments of dark matter, believed by many astronomers to form the basis of the universe. (Dictionary.com)
The idea of the cosmic web and seeing the universe as a set of discrete galaxies held together by gravity—is deeply ingrained in cosmology.
I came across this website “The Network behind the Cosmic Web” and it’s amazing video that assist physicists in answering some long-standing questions, for example, how is the universe organised?
The website appreciates that there is more to the stars that we see in the night sky.
Little is known about the architecture of this network or its characteristics.
Researchers used data from 24,000 galaxies to construct multiple models of the cosmic web, offering complex blueprints for how galaxies fit together.
On the web site there are three interactive visualisations to help people imagine the cosmic web, showing the differences between the models, and giving insight into the fundamental structure of the universe.
For the majority of us, we have delved into a very complex area, however, let’s check out the visualisations.
For people seeking to know more about the universe, this modelling has allowed people to see the relationships and connections in ways never before seen.
By presenting the information graphically, it has created a platform to focus the conversation on what they can see, then, ask questions about what they can’t see.
Presenting information graphically may also attract a number of other people who wouldn’t necessarily be interested in the subject matter.
This is a great example of the power of visualisations.
Visualisations in Technology
When it comes to other disciplines in Technology such as the development of systems and written documentation, diagrams, drawings, images and models will always convey architecture and designs more effectively allowing a wider audience to engage in the subject matter.
It’s diagrams verses textual documentation.
If we take an analogy from our article, the Universe is our document the visualisations are the diagrams explaining the document.
If this is the case, we must make the explanation of technology simple so more people understand it so they can plan, build and run it more effectively.
Your Assignment
Take a technical specification and check out how many pages you have in the document. See how many pages have diagrams.
Go through the document and review how many pages or sections that don’t have diagrams could use a diagram to explain something more easily.
Example:
If there is a section that runs for 2 or 3 pages in a document, could those pages be transformed into a diagram?
Go back through the whole diagram and calculate how many pages could be saved.
This small exercise could be turned into a calculation working out savings in documentation.
But overall consider this:
- How much easier will it be in explaining the contents of the document?
- How much more engaging will it be for the reader keeping their attention on the content?
- How much time will be saved in delivering the product?
There’s probably more questions you could ask but you get the picture, the ultimate benefit.
I hope this makes sense.
Chris
Sources:
Visualising The Cosmic Web That Holds The Universe Together
The Cosmic Web

Leave a Reply
You must be logged in to post a comment.